The goal of my project was to make a 3D music visualizer.
Concepts Implemented
My project implemented three major concepts: a dynamic mesh, sound analysis, and Blinn Phong Shading.
The dynamic mesh within my program consisted of a flat, square grid of 129 by 129 verticies.
Also, every square has a line in it from its top right corner to its lower left corner, forming the triangles used by OpenGL to draw images.
The mesh was set up this way in order to take advantage of the way I analyzed sound, described in the paragraph below.
Each point was affected by the frequency of the song based on the distance that point had to the center of the mesh.
This allowed the resulting image to appeared circular by rasing every point with the same radius by the same height.
For sound analysis, I used FMOD Ex, a free sound library, to gather the left and right sprectums of a song at any given point.
These spectrums were arrays representing the song's frequency, split into 64 different ranges, while the values within the array represented the loudness of the song in decibels.
By taking the average of the left and right spectrum, I was able to store the song's overall frequency and use it to change the height of the verticies in my mesh appropriately.
The Blinn Phong shading in the program was the same as discussed in class except for the material's diffuse color.
While the other attributes of the material were hard coded, the diffuse color was calculated with perlin noise.
By doing so, the color of the image changes at every moment, in a seeming random, flowing pattern.
This pattern gave the program its title since the resulting colors resemble disco lights flashing in the dark.
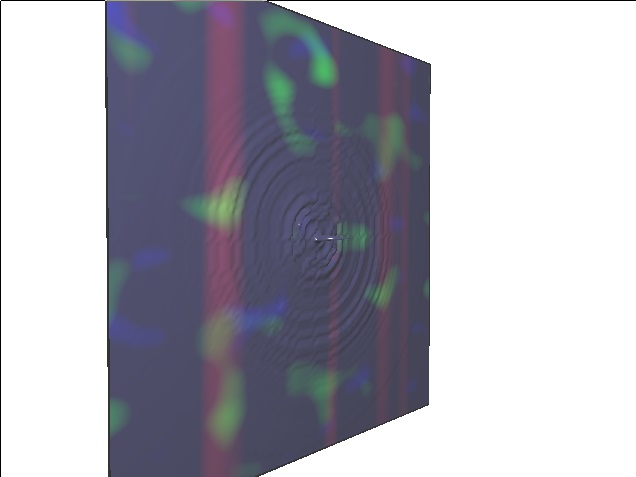
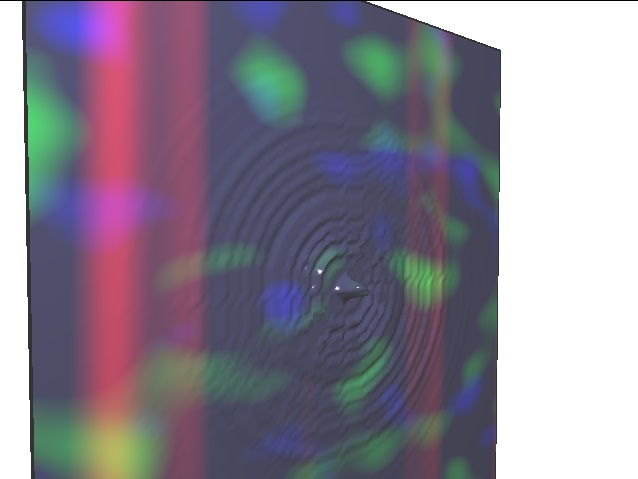
The resulting image on the opening of "The Eye of the Tiger." Notice the height of the rupple is low, similar to the song's quiet start.
On the other hand, the rupple much more noticible and varied as the song starts to get louder and different frequencies (sounds and instruments) start playing.
The first picture above is this exact moment seen at an angle.
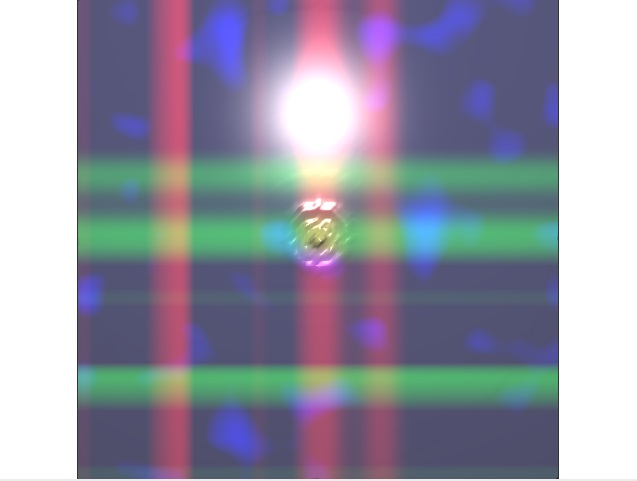
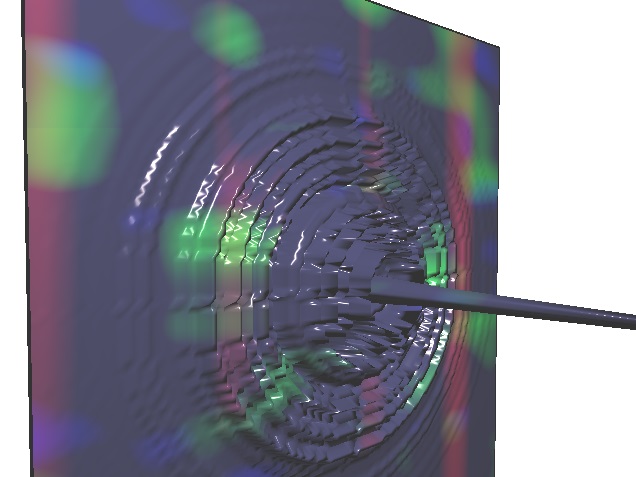
Since the difference of each range in frequency can be hard to see, I added a way to normalize the song's spectrum at any given point.
By pressing a button, we can see the difference between the higher pitched frequencies (center) to the lower ones.
The moment above is the same as the picture above it.
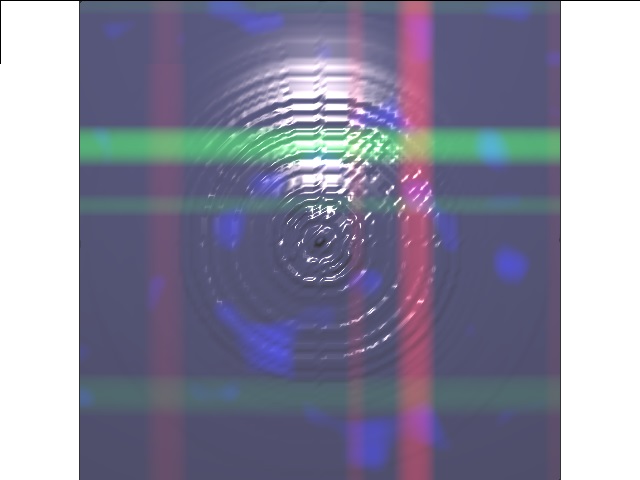
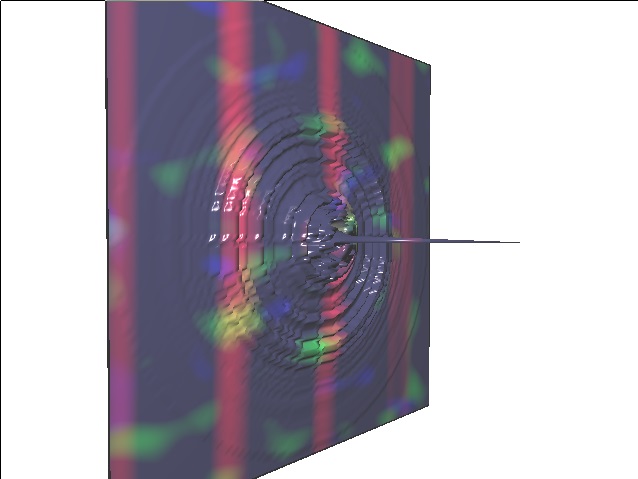
Another moment within the song, seen at a closer distance.
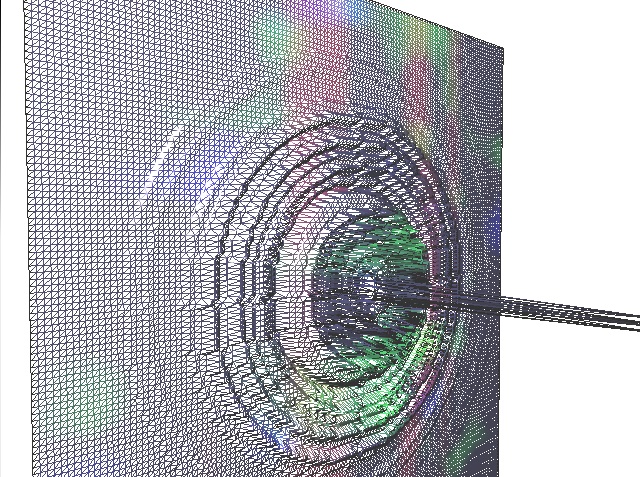
Now normalized.
Now normalized and only with the wireframe drawn.
The colors are always different due to the perlin shader using time as one of its inputs.
Technical Difficulties Encountered
I experienced two large difficulties during my programming.
The first dealt with calculating the frequencies of a song at any given point.
In the beginning, I tried to calculate the spectrum on my own, but was quickly overwhelmed by the theory behind doing so (fast fourier transform for anyone interested).
Since I wasn't able do the calculations on my own, I searched online for a library that could do so for me and eventually found FMOD Ex and a tutorial on how to do so.
Normalizing every vertex normal after changing the verticies was the second difficulty I faced.
This was simpler to solve since I only needed to add the face normals of the triangles surrounding a vertex in order to get that vertex's normal.
The hard part was thinking of an algorithm that would do so correctly with my set up.
In the end, I settled for searching for a vertex's important neighboring verticies (up, left, downLeft, down, right, and upRight), summing the face normals of the surroundung triangles, and normalizing the resulting value.
General Skills Encountered
Besides the concepts mentioned above, I also learned about using outside libraries and makefiles.